Research-informed visual library
Osteoporosis Image Library
A custom leereichelMD.com image library for osteoclasts, osteoblasts, remodeling, osteocytes, trabecular bone, cortical bone, menopause changes, and bone microarchitecture. These replace generic stock images with original teaching visuals informed by histology, micro-CT, HR-pQCT, and radiograph-style research imagery.
Cells and Remodeling
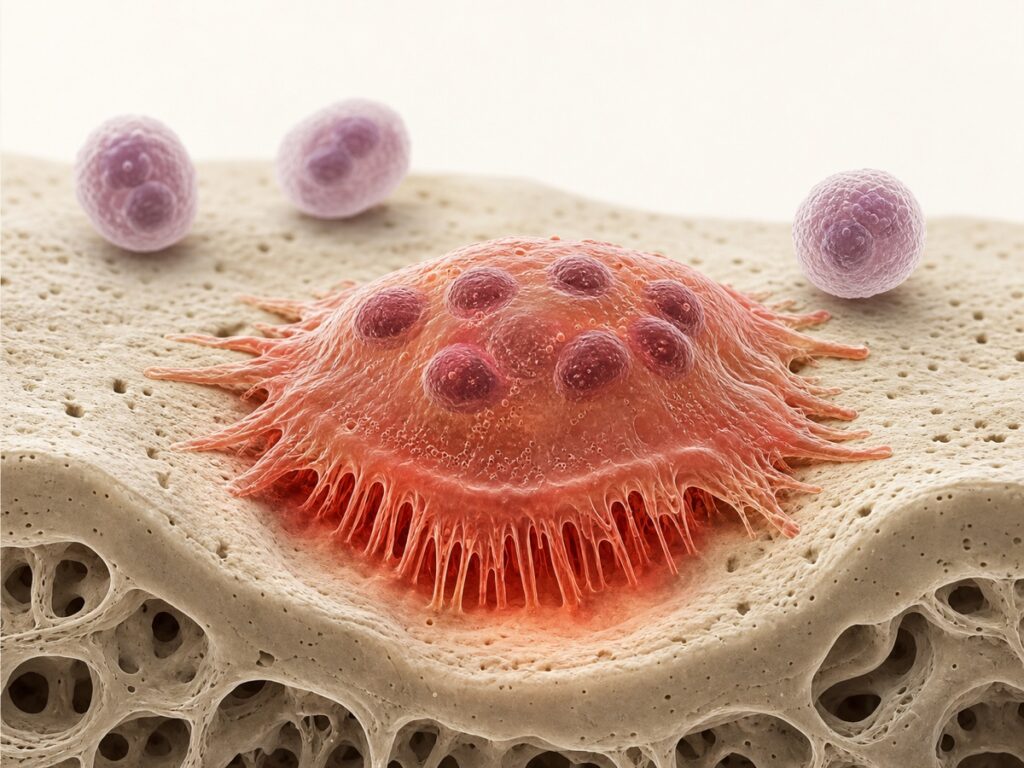
These illustrations focus on the living cellular work of bone: resorption, formation, remodeling coordination, and osteocyte signaling from within mineralized matrix.
Osteoclasts
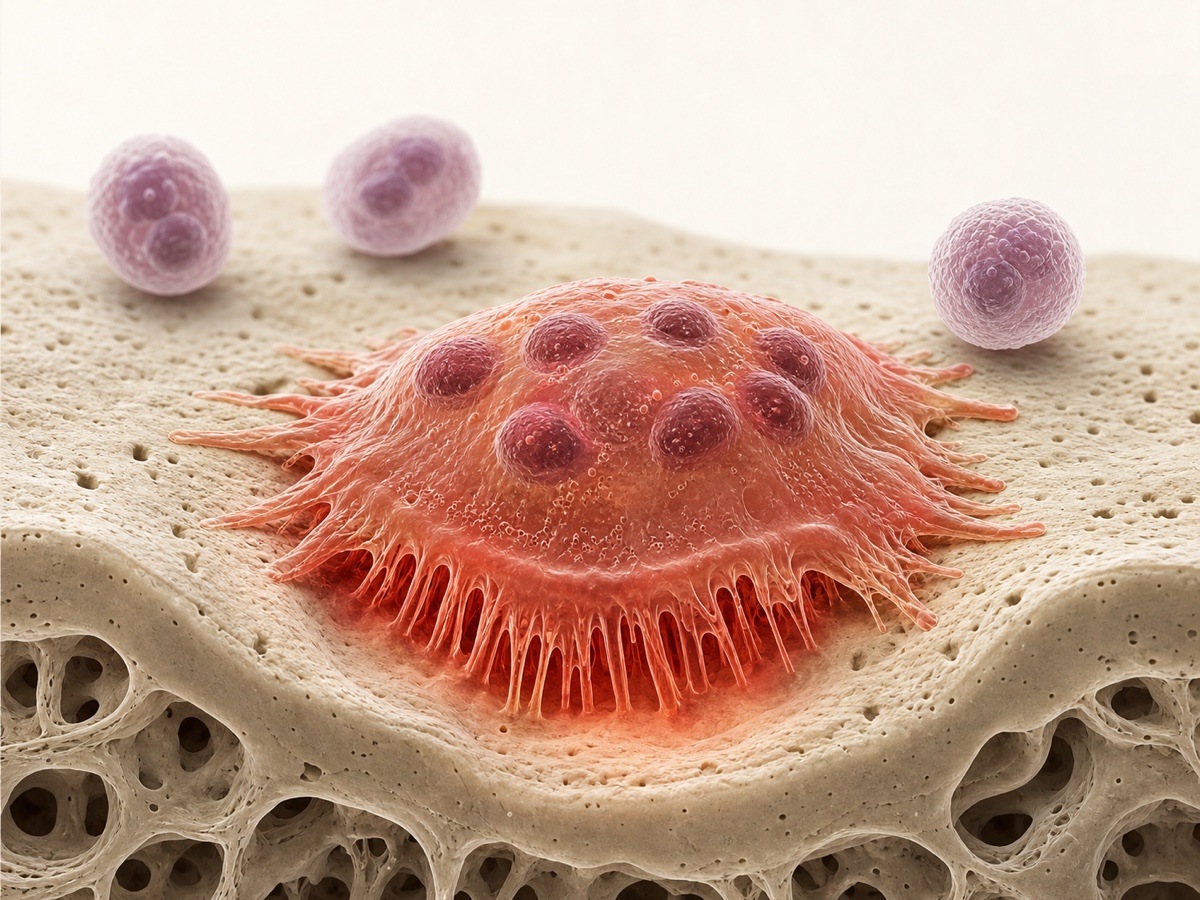
Where to look: the osteoclast is the large orange, many-nucleated cell spread across the center of the bone surface; the darker scalloped area beneath it represents active resorption. Osteoclasts attach to bone, create a sealed resorption zone, and remove mineralized matrix during remodeling.
Research basis: osteoclast-mediated resorption and bone multicellular unit remodeling are described in cellular remodeling reviews.1,2

Osteoblasts
Where to look: the osteoblasts are the row of blue cuboidal cells lining the pale new matrix along the bone surface; the purple star-shaped cells embedded deeper in bone are osteocytes. Osteoblasts produce osteoid, the new matrix that later mineralizes into bone.
Research basis: remodeling reviews describe osteoblast formation, osteoid deposition, and coupling after resorption.1,2

Remodeling Cycle
Where to look: the orange osteoclasts in the resorption pit are removing bone, the small purple cells mark the reversal phase, and the teal-blue lining cells on the right are osteoblasts laying down new osteoid. Bone remodeling is a coordinated cycle of activation, resorption, reversal, formation, and mineralization.
Research basis: the remodeling sequence and coupling of osteoclast and osteoblast activity are summarized in PubMed-indexed remodeling reviews.1,2
Osteocytes
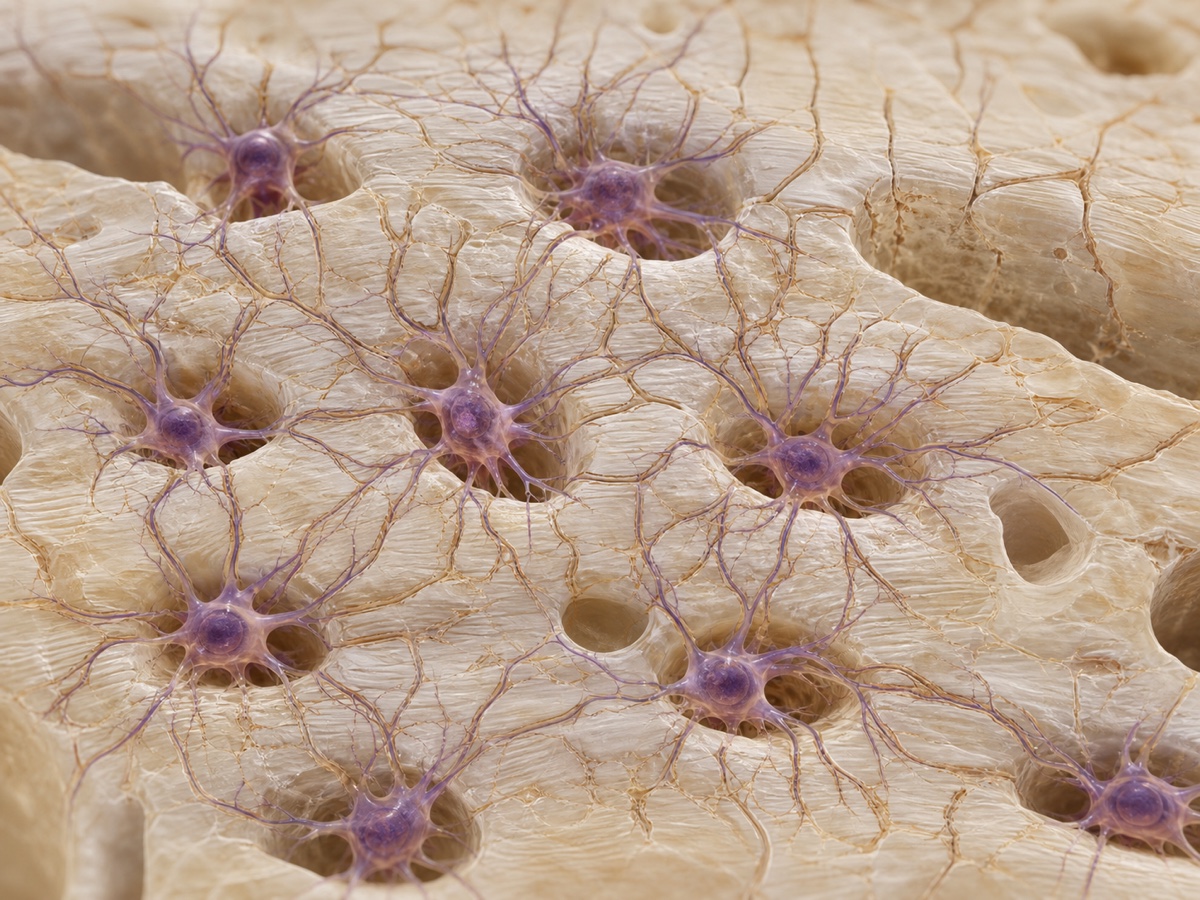
Where to look: the osteocytes are the purple star-shaped cells embedded inside small spaces in the mineralized bone; the fine branching lines between them are canaliculi. Osteocytes help sense mechanical strain and coordinate remodeling signals.
Research basis: osteocyte reviews describe the lacunar-canalicular network, mechanosensing, sclerostin, and remodeling control.3
Structure and Imaging
These structural images borrow the visual language of micro-CT, HR-pQCT, and radiographic cross-sections while remaining original illustrations. They help show why bone quality and architecture matter alongside bone density.
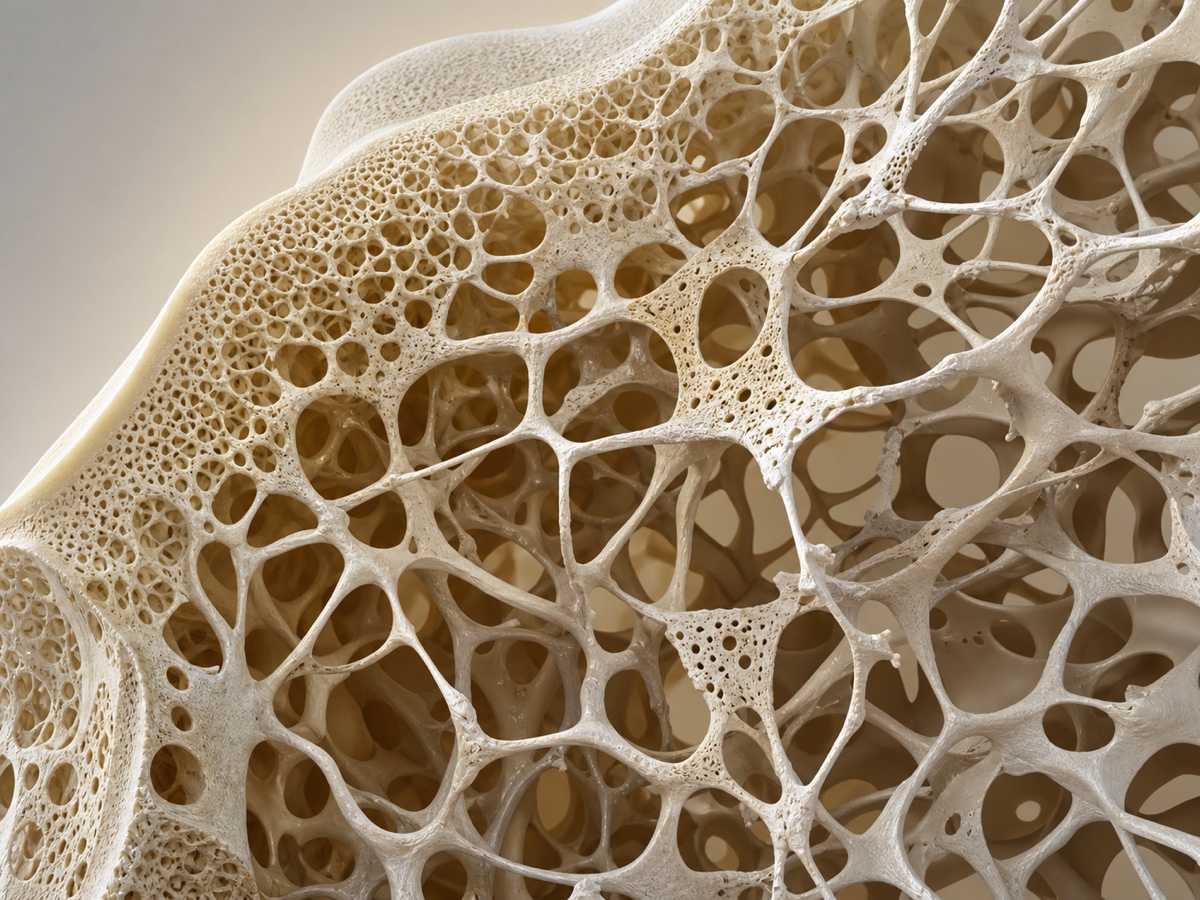
Trabecular Bone
Where to look: trabecular bone is the inner white lattice of struts and plates, with open marrow spaces between them. In osteoporosis, these struts can thin, disconnect, or perforate, leaving larger spaces and less structural support.
Research basis: HR-pQCT and micro-CT literature links trabecular number, thickness, separation, and connectivity to bone strength.5,6,7
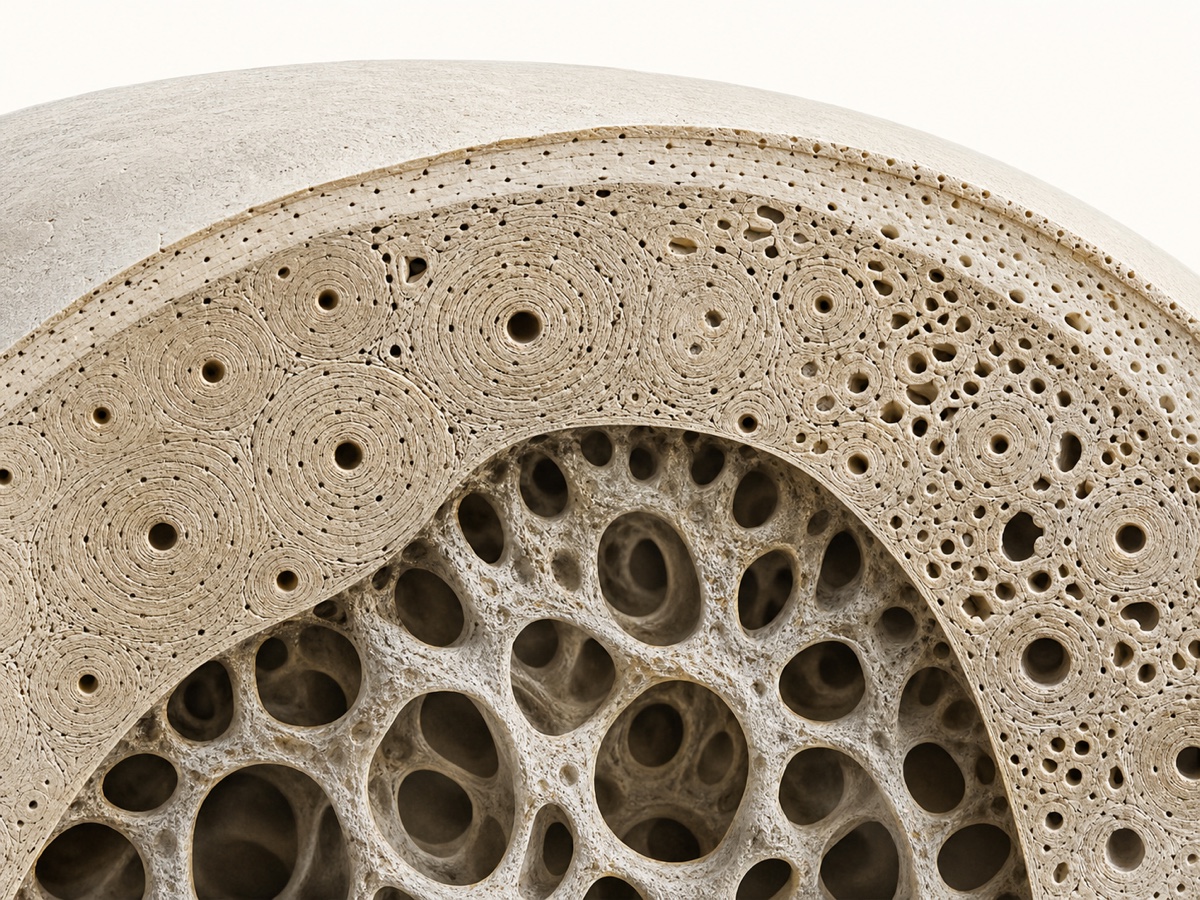
Cortical Bone
Where to look: cortical bone is the dense curved outer shell; the circular rings are osteons, the central holes are Haversian canals, and the smaller dark openings show cortical pores. With age and bone loss, the cortex can thin and become more porous.
Research basis: HR-pQCT and aging literature describe cortical thickness, cortical porosity, and structural compromise.5,7
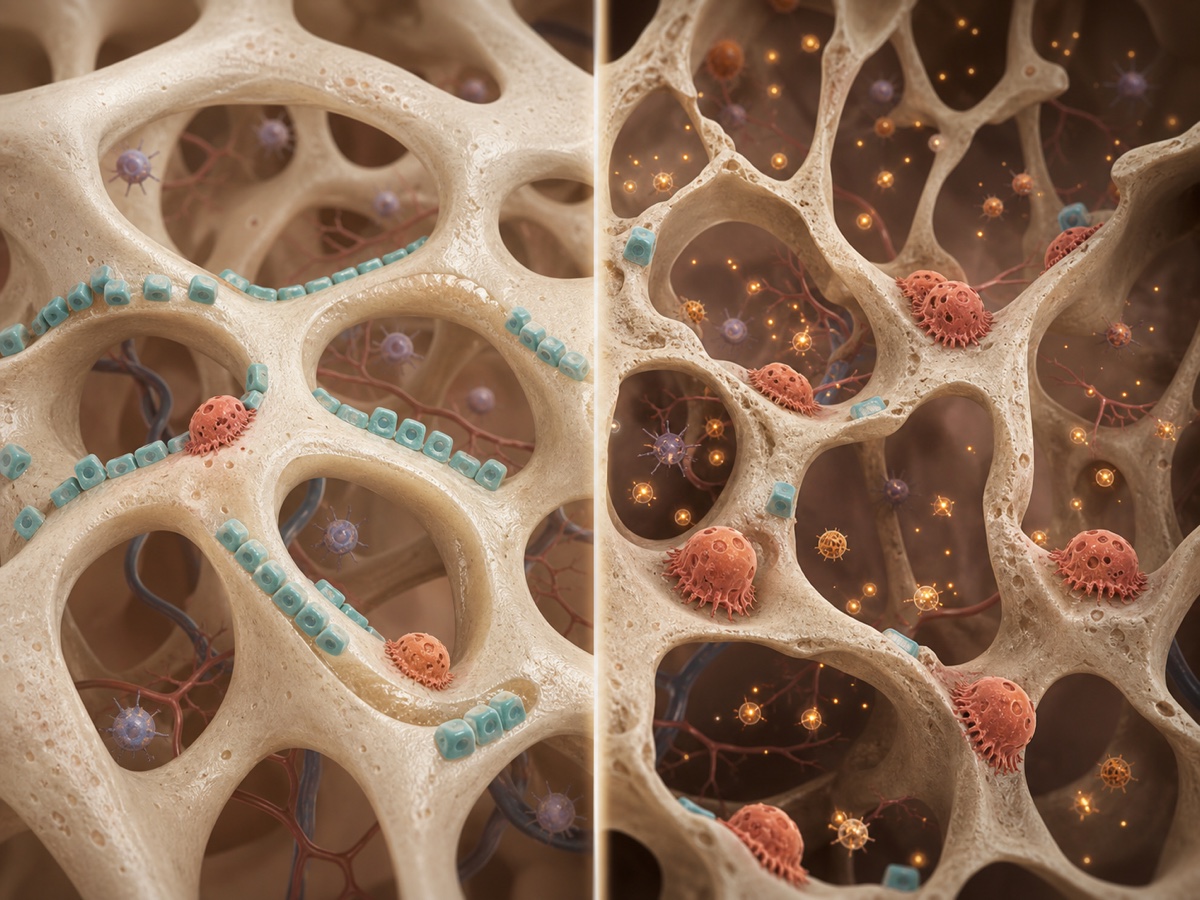
Menopause Changes
Where to look: the left side shows more balanced remodeling with blue osteoblast lining cells, while the right side shows more orange osteoclast activity and wider open spaces, representing higher resorption after estrogen decline. This is a mechanism visual, not an individual risk prediction.
Research basis: estrogen and skeleton reviews describe effects on osteoclasts, osteoblasts, osteocytes, and postmenopausal bone loss.4,7
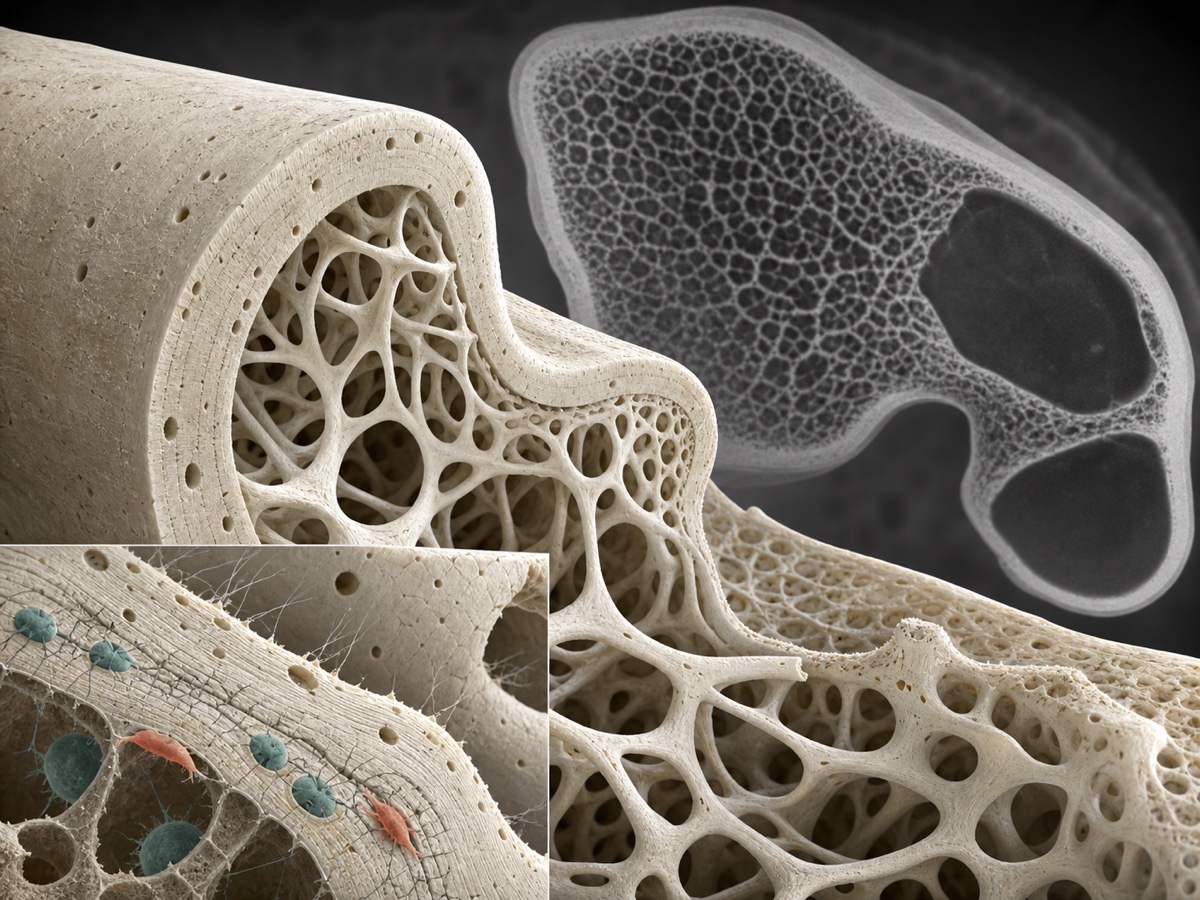
Bone Microarchitecture
Where to look: the thick outer shell is cortical bone, the internal white lattice is trabecular bone, and the inset/gray views show the same architecture at closer and radiograph-like scales. Microarchitecture helps explain why bone strength is broader than density alone.
Research basis: clinical imaging and micro-CT research describe cortical and trabecular microarchitecture as part of bone quality.5,6,7
How These Images Should Be Used
This collection is ready to reuse across leereichelMD.com articles, newsletters, printable handouts, and future educational lessons.
References
- Morin SN, Leslie WD, Schousboe JT. Osteoporosis: a review. JAMA. 2025. doi:10.1001/jama.2025.6003.
- Compston JE, McClung MR, Leslie WD. Osteoporosis. Lancet. 2019;393(10169):364-376. doi:10.1016/S0140-6736(18)32112-3.
- Morin SN, Leslie WD, Schousboe JT. Osteoporosis: a review. JAMA. 2025. doi:10.1001/jama.2025.6003.
- Walker MD, Shane E. Postmenopausal osteoporosis. N Engl J Med. 2023;389(21):1979-1991. doi:10.1056/NEJMcp2307353.
- Shevroja E, Lamy O, Kohlmeier L, Koromani F, Rivadeneira F, Hans D. Use of trabecular bone score (TBS) as a complementary approach to dual-energy x-ray absorptiometry (DXA) for fracture risk assessment in clinical practice. J Clin Densitom. 2017;20(3):334-345. doi:10.1016/j.jocd.2017.06.019.
- Compston JE, McClung MR, Leslie WD. Osteoporosis. Lancet. 2019;393(10169):364-376. doi:10.1016/S0140-6736(18)32112-3.
- Walker MD, Shane E. Postmenopausal osteoporosis. N Engl J Med. 2023;389(21):1979-1991. doi:10.1056/NEJMcp2307353.
- Morin SN, Leslie WD, Schousboe JT. Osteoporosis: a review. JAMA. 2025. doi:10.1001/jama.2025.6003.
Educational Note
This site is educational and does not replace care from your clinician.